Log In
 Register Now!
 Help
Help

>And there's another assumption everyone seems to make that's outright wrong. Notch 1 is not 1/8th power, notch 2 isn't 2/8th power, etc. It's not directly proportional by any means, for the exact reason that applying 12.5% power in notch 1 would be far more than anyone would want for a light engine.
Could you show a manual that gives these figures?
Eng Files for USA diesels
Looking for data...
Rate Topic:

#31

- Open Rails Developer
-

- Group: ET Admin
- Posts: 1,781
- Joined: 26-February 08
- Gender:Male
- Location:Eltham, Victoria, Australia
- Simulator:ORNYMG
-
Country:

Posted 21 August 2021 - 05:06 PM
#32
- Open Rails Developer
-
- Group: ET Admin
- Posts: 1,781
- Joined: 26-February 08
- Gender:Male
- Location:Eltham, Victoria, Australia
- Simulator:ORNYMG
-
Country:
Posted 21 August 2021 - 05:46 PM
>And there's another assumption everyone seems to make that's outright wrong. Notch 1 is not 1/8th power, notch 2 isn't 2/8th power, etc
With first generation diesels ( 567 ) using the Woodward governor, the control servo's would give the notches approximately equal spacing from 275 to 800 revs.
This arrangement would see that the power for each notch would be increased approximately by 12.5% given hardware limitations.
When we got to second generation diesels, changes could be made to the power curve and invariably did.
#33
- Engineer
-
- Group: Status: Contributing Member
- Posts: 664
- Joined: 17-November 13
- Gender:Male
- Location:Seattle, WA
- Simulator:Open Rails
-
Country:

Posted 21 August 2021 - 09:25 PM
engmod, on 21 August 2021 - 05:46 PM, said:
>And there's another assumption everyone seems to make that's outright wrong. Notch 1 is not 1/8th power, notch 2 isn't 2/8th power, etc
With first generation diesels ( 567 ) using the Woodward governor, the control servo's would give the notches approximately equal spacing from 275 to 800 revs.
This arrangement would see that the power for each notch would be increased approximately by 12.5% given hardware limitations.
When we got to second generation diesels, changes could be made to the power curve and invariably did.
With first generation diesels ( 567 ) using the Woodward governor, the control servo's would give the notches approximately equal spacing from 275 to 800 revs.
This arrangement would see that the power for each notch would be increased approximately by 12.5% given hardware limitations.
When we got to second generation diesels, changes could be made to the power curve and invariably did.
So, in the case of the first generation diesels I'm using for experimentation (E8, F7 and GP9), the formula would be:
(308*(HP*(rpm/max rpm)))/mph
Is my assumption correct?
#34
- Open Rails Developer
-
- Group: ET Admin
- Posts: 1,781
- Joined: 26-February 08
- Gender:Male
- Location:Eltham, Victoria, Australia
- Simulator:ORNYMG
-
Country:
Posted 21 August 2021 - 09:40 PM
What are you trying to calculate?
Just found it, tractive effort in LB's
The 308 is not an assumption, its a well known number.
The idea of rpm/max rpm will not work, you must use 1/8 for notch 1 and 4/8 for notch 4 and so on.
Just found it, tractive effort in LB's
The 308 is not an assumption, its a well known number.
The idea of rpm/max rpm will not work, you must use 1/8 for notch 1 and 4/8 for notch 4 and so on.
#35
- Superintendant
-

- Group: Status: Elite Member
- Posts: 1,249
- Joined: 25-September 17
- Gender:Male
- Simulator:Open Rails
-
Country:

Posted 22 August 2021 - 12:02 AM
This source given by Eric is regarding the SD-40.
https://web.archive.org/web/20090415180412/http://www.alkrug.vcn.com/rrfacts/fuelSD40.htm
Am I correct that this is considered to be a US second generation diesel in this conversation? (I am guessing that 1st is 1930s-1950s with manual transitioning, 2nd is 1950s-1970s with dc generator and automatic field weakening, 3rd 1970s-2000s with alternator rather than generator and 4th 1990s-present with ac traction motors...)
7% of power is given in notch 1, rising to 36% in notch 4. It could probably be used to estimate power output at different notches for the engines on this list
https://web.archive....cts/fueluse.htm
bearing in mind that fuel use is generally most efficient at middle to high rpm.
#36
- Engineer
-
- Group: Status: Contributing Member
- Posts: 664
- Joined: 17-November 13
- Gender:Male
- Location:Seattle, WA
- Simulator:Open Rails
-
Country:
Posted 22 August 2021 - 03:44 PM
engmod, on 21 August 2021 - 09:40 PM, said:
What are you trying to calculate?
Just found it, tractive effort in LB's
The 308 is not an assumption, its a well known number.
The idea of rpm/max rpm will not work, you must use 1/8 for notch 1 and 4/8 for notch 4 and so on.
Just found it, tractive effort in LB's
The 308 is not an assumption, its a well known number.
The idea of rpm/max rpm will not work, you must use 1/8 for notch 1 and 4/8 for notch 4 and so on.
So I was correct the first time. Thanks!
#37
- Open Rails Developer
-
- Group: ET Admin
- Posts: 1,781
- Joined: 26-February 08
- Gender:Male
- Location:Eltham, Victoria, Australia
- Simulator:ORNYMG
-
Country:
Posted 22 August 2021 - 03:55 PM
#38
- Open Rails Developer
-
- Group: ET Admin
- Posts: 1,781
- Joined: 26-February 08
- Gender:Male
- Location:Eltham, Victoria, Australia
- Simulator:ORNYMG
-
Country:
Posted 22 August 2021 - 04:08 PM
>Am I correct that this is considered to be a US second generation diesel in this conversation?
I have not seen these separated by the dates you suggest, but on checking, the dates ranges appear to relate to changes in traction percentage efficiency.
I have not seen these separated by the dates you suggest, but on checking, the dates ranges appear to relate to changes in traction percentage efficiency.
#39
- Open Rails Developer
-
- Group: Status: Elite Member
- Posts: 1,889
- Joined: 24-June 11
- Gender:Male
-
Country:
Posted 22 August 2021 - 04:31 PM
Traindude, on 21 August 2021 - 09:25 PM, said:
So, in the case of the first generation diesels I'm using for experimentation (E8, F7 and GP9), the formula would be:
(308*(HP*(rpm/max rpm)))/mph
Is my assumption correct?
(308*(HP*(rpm/max rpm)))/mph
Is my assumption correct?
There is also a formula with a number of 375 instead of the 308 value.
It all depends upon the power (hp) value used in the formula. Have a look at this post for some more detail.
Hence, if the HP value is the output power of the diesel engine then it needs to be derated to allow for losses in traction motors, generators, etc. Hence 308/375 (approx 82%) is a generic value that facilitates this derating.
However if the HP value is actually the power after these losses have been taken into account, then 375 should be used.
#40
- Executive Vice President
-
- Group: ET Admin
- Posts: 3,447
- Joined: 14-March 13
- Gender:Male
- Location:known universe
- Simulator:Open Rails
-
Country:
Posted 23 August 2021 - 11:55 AM
I have been able to duplicate Traindudes' problem with the EMD E8 having insufficient TE in Notch1.
I've always been suspicious about this...but put the problem on the back-burner...thanks to Traindude for providing a friendly push in the caboose to look for a solution.
As can be seen from the curve set, the individual curves in the set are no longer capped at a lower TE than the Maximum TE for an E8. I'm dubious about going higher than the MaxTE, even though that happens in real operations and testing...BUT...all the documentation I've seen and read states that the higher than Maximum Tractive Effort measured in a diesel-electric locomotive are momentary. Emphasis on the momentary. These higher numbers are not sustained. AFAIK.
All power settings now reach maximum TE for the E8. I'm making some other new curves up for other engines and will "foist" them upon some people for testing -- if they are amenable to the foisting.
Here's what the revised Max TE curve set will look like for the Ver3 Std_Eng files.
This is for the EMD E8: UoM are meters per sec ( m/s) & Newtons (N). Rail HP used to calculate tractive force.
This formula used to calculate curve sets: Tractive Effort vs Power - Page10
Specifications for E8:
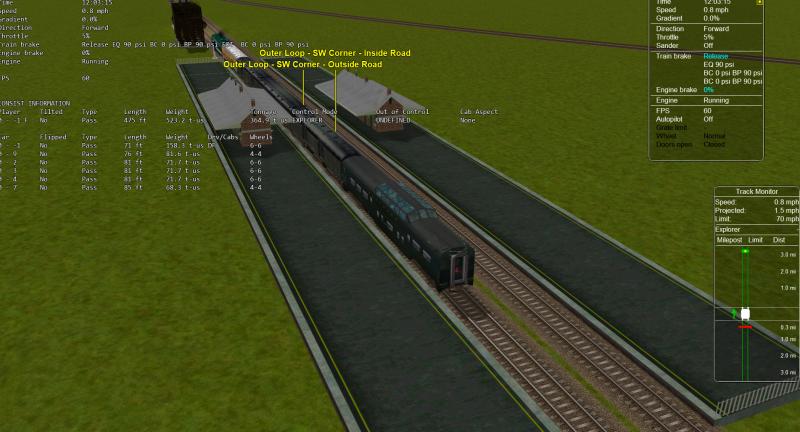
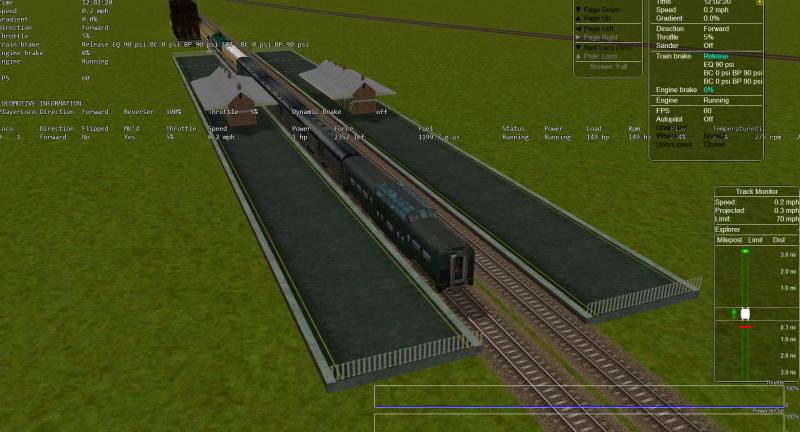
Posted some relevant screenshots below. These show performance using Ver2 Max TE Curve sets.
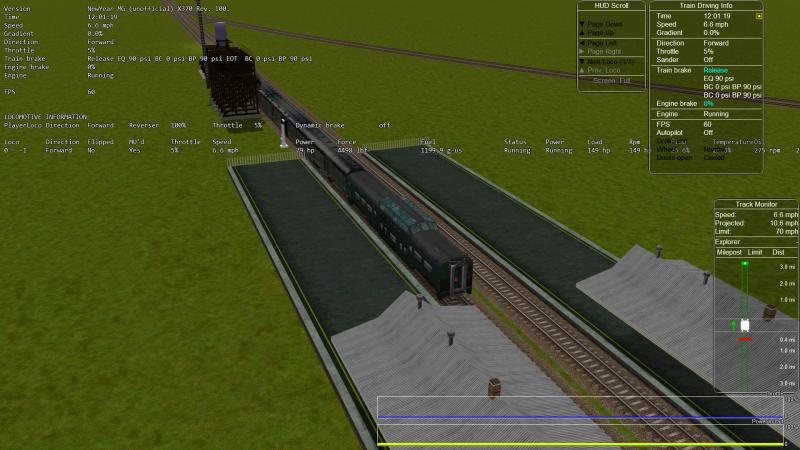
Last Screenshot shows performance at Notch1 with new curve sets as shown above.
Lastly -- much thanks to Peter Newell for his grand Test Layout/Route...it's a gem!! (and of course for his tireless efforts in trying to improve Open Rails...and all the information on the website Coals to Newcastle
I've always been suspicious about this...but put the problem on the back-burner...thanks to Traindude for providing a friendly push in the caboose to look for a solution.
As can be seen from the curve set, the individual curves in the set are no longer capped at a lower TE than the Maximum TE for an E8. I'm dubious about going higher than the MaxTE, even though that happens in real operations and testing...BUT...all the documentation I've seen and read states that the higher than Maximum Tractive Effort measured in a diesel-electric locomotive are momentary. Emphasis on the momentary. These higher numbers are not sustained. AFAIK.
All power settings now reach maximum TE for the E8. I'm making some other new curves up for other engines and will "foist" them upon some people for testing -- if they are amenable to the foisting.
Here's what the revised Max TE curve set will look like for the Ver3 Std_Eng files.
This is for the EMD E8: UoM are meters per sec ( m/s) & Newtons (N). Rail HP used to calculate tractive force.
This formula used to calculate curve sets: Tractive Effort vs Power - Page10
Specifications for E8:
Quote
Comment ( VER3 Standard ORTS Diesel Engine for EMD E8A Unit Locomotives, two diesel engines per unit )
Comment ( AAR Wheel Configuration == A1A-A1A )
Comment ( Locomotive Cyclopedia of American Practice 14thEd. 1950-52, Section 1 Pages:129-131 )
Comment ( Specifications per Operating Manual No.2311 July, 1951 3rd Edition and derived from Bob Boudoin physics )
Comment ( Frontal Area == cross sectional area == 12.93 meters squared = 139.1774ft^2 )
Comment ( Power Ratings == Gross HP 2380 == Traction HP 2250 == Rail HP 1838 )
Comment ( Continuous Tractive Effort 29203lb @ 23.3mph==81.7%eff. == Starting Tractive Effort 51856lb )
Comment ( A Unit Mass 316584lbs == 143.6t == metric )
Comment ( Weight on Drivers 211056lbs == 95.733t == metric, Adhesion Factor = 24.57% )
Comment ( Mass×Adhesion Factor = Starting Tractive Effort )
Comment ( Brake HP -- bhp = Power-at-the-shaft = Gross HP or MaximalPower )
Comment ( Gross HP per technical specs or lacking good data == add 130hp to 150hp to Traction HP )
ORTSMaxTractiveForceCurves (
    	0 (
    		0	0
    		0.74	0
    		1.47	0
    		2.21	0
    		2.94	0
    		3.68	0
    		4.41	0
    		5.14	0
    		5.87	0
    		8.69	0
    		12.29	0
    		16.76	0
    		21.90	0
    		26.82	0
    		32.19	0
    		38.00	0
    		44.70	0
    		53.64	0	)
    0.125 (
    		0	230521
    		0.74	229183
    		1.47	115371
    		2.21	76740
    		2.94	57686
    		3.68	46086
    		4.41	38457
    		5.14	32989
    		5.87	28892
    		8.69	19506
    		12.29	13796
    		16.76	10117
    		21.90	7743
    		26.82	6323
    		32.19	5270
    		38.00	4464
    		44.70	3794
    		53.64	3162	)
    0.25 (
    		0	230521
    		1.47	230333
    		2.21	153208
    		2.94	115167
    		3.68	92008
    		4.41	76778
    		5.14	65861
    		5.87	57682
    		8.69	38942
    		12.29	27542
    		16.76	20198
    		21.90	15458
    		26.82	12624
    		32.19	10520
    		38.00	8911
    		44.70	7575
    		53.64	6312	)
    0.375 (
    		0	230521
    		2.21	229676
    		2.94	172648
    		3.68	137930
    		4.41	115098
    		5.14	98733
    		5.87	86471
    		8.69	58378
    		12.29	41289
    		16.76	30279
    		21.90	23173
    		26.82	18924
    		32.19	15770
    		38.00	13359
    		44.70	11355
    		53.64	9462	)
    0.50 (
    		0	230521
    		2.94	230129
    		3.68	183853
    		4.41	153419
    		5.14	131605
    		5.87	115261
    		8.69	77813
    		12.29	55035
    		16.76	40359
    		21.90	30887
    		26.82	25225
    		32.19	21021
    		38.00	17806
    		44.70	15135
    		53.64	12613	)
    0.625 (
    		0	230521
    		3.68	229939
    		4.41	191876
    		5.14	164594
    		5.87	144153
    		8.69	97319
    		12.29	68831
    		16.76	50476
    		21.90	38630
    		26.82	31548
    		32.19	26290
    		38.00	22269
    		44.70	18929
    		53.64	15774	)
    0.75 (
    		0	230521
    		4.41	230197
    		5.14	197467
    		5.87	172942
    		8.69	116755
    		12.29	82577
    		16.76	60557
    		21.90	46345
    		26.82	37848
    		32.19	31540
    		38.00	26717
    		44.70	22709
    		53.64	18924	)
    0.875 (
    		0	230521
    		5.14	230339
    		5.87	201732
    		8.69	136190
    		12.29	96324
    		16.76	70638
    		21.90	54060
    		26.82	44149
    		32.19	36791
    		38.00	31164
    		44.70	26489
    		53.64	22075	)
    1.0 (
    		0	230521
    		5.87	230521
    		8.69	155626
    		12.29	110070
    		16.76	80718
    		21.90	61774
    		26.82	50449
    		32.19	42041
    		38.00	35611
    		44.70	30270
    		53.64	25225	)
 		)
Posted some relevant screenshots below. These show performance using Ver2 Max TE Curve sets.
Last Screenshot shows performance at Notch1 with new curve sets as shown above.
Lastly -- much thanks to Peter Newell for his grand Test Layout/Route...it's a gem!! (and of course for his tireless efforts in trying to improve Open Rails...and all the information on the website Coals to Newcastle