Elvas Tower: Two suggestions for Trackviewer - Elvas Tower

Jump to content

  • 5 Pages +
  • « First
  • 2
  • 3
  • 4
  • 5
  • You cannot start a new topic
  • You cannot reply to this topic

Two suggestions for Trackviewer Rate Topic: -----

#31 User is offline   JeroenP 

  • Fireman
  • Group: Status: Active Member
  • Posts: 179
  • Joined: 28-December 13
  • Gender:Male
  • Simulator:ORTS
  • Country:

Posted 23 May 2015 - 10:49 PM

View PostCsantucci, on 23 May 2015 - 05:21 AM, said:

Thanks Jeroen! I immediately tested it with the short but demanding Bernina Freeware.

I find it impressive (by the way I appreciated how the original author of the route respected the real track profile, that has a maximum grade of 7%. As can be seen, there is something strange in the horizontal legend of the profile.

I have Bernina as well. The horizontal legend is fine. It shows distance along the path (0, 10km, 20km, ...). What I think you mean is that the grade is printed for every change in grade in the chart. That text is rotated 90degrees. And it shows that on these very long routes, only having text for grade showing is not useful (without zoom at least). Only on the longer flat regions you can read '0.0'. But the grade-chart indeed shows this 7% nicely.

View PostCsantucci, on 23 May 2015 - 05:21 AM, said:

I think that it would be nice if the station names could be added.
Then I will make that a high-priority


I created a new topic to discuss showing terrain. So this topic can be used for the track-charts: http://www.elvastowe...er-and-terrain/
Jeroen

#32 User is offline   steamer_ctn 

  • Open Rails Developer
  • Group: Status: Elite Member
  • Posts: 1,889
  • Joined: 24-June 11
  • Gender:Male
  • Country:

Posted 23 May 2015 - 11:22 PM

Hi Jeroen,

This will be a great feature addition to assist players with visualising the track conditions.

Would it be possible to zoom in on the profile, and use a slider bar so that long routes could be explored in more detail, this would also allow more granularity in the display of track gradients, etc?

Are reversing points interpreted as broken paths when attempting to display the profile? I attempted to display a good path with a number of reversing points in it, and I got a broken path error message. This would make a certain amount of sense as the path "doubles" back on itself, and the gradient profile is then no longer continuous. Perhaps the error message should indicate a reversing point, rather then a broken path?

Thanks

#33 User is offline   JeroenP 

  • Fireman
  • Group: Status: Active Member
  • Posts: 179
  • Joined: 28-December 13
  • Gender:Male
  • Simulator:ORTS
  • Country:

Posted 27 May 2015 - 11:21 AM

View PostGenma Saotome, on 21 May 2015 - 01:37 PM, said:

The reasoning behind using a vertical display comes from a discussion last year (I think) about the feasibility of using a smart phone or tablet (which are often in a the portrait orientation) for reading help text and/or any other text produced by the OR software. James said it would be pretty easy to add an html "broadcast" feature to enable the idea.

I could not find a reference/post related to this broadcast feature. But I have been thinking. As far as I can see it, would it not be easiest just to have a html page (as an alternative output mechanism next to the more interactive current WPF window?). Or perhaps a html-page and then a javascript to read something that was generated from trackviewer? In that way it is also possible to optimize the output of html independent of the WPF window, and use, for instance, a vertical profile. I have not tried this, but would that not be more flexible?


View Poststeamer_ctn, on 23 May 2015 - 11:22 PM, said:

Hi Jeroen,This will be a great feature addition to assist players with vizualising the track conditions.Would it be possible to zoom in on the profile, and use a slider bar so that long routes could be explored in more detail, this would also allow more granularity in the display of track gradients, etc?

Zooming is indeed on my list. But I did not yet consider the idea of a slider bar, so thanks for that idea.

View Poststeamer_ctn, on 23 May 2015 - 11:22 PM, said:

Are reversing points interpreted as broken paths when attempting to display the profile? I attempted to display a good path with a number of reversing points in it, and I got a broken path error message. This would make a certain amount of sense as the path "doubles" back on itself, and the gradient profile is then no longer continuous. Perhaps the error message should indicate a reversing point, rather then a broken path?Thanks

Reversing points should not be a problem. In fact, the example I showed has reversing points. However, the path could be broken. You can see this by selecting in the menu->Statusbar->Show path info. And then in the statusbar you might see something like: itr (traffic 01).pat (good end, broken). If it says broken, it is broken, and if it does not you should be able to get a chart. If you use page-down to show less of the path, at some point the latest drawn node will be the broken node and then the statusbar also tells you why the node is considered to be broken, e.g. something like: (type=Other) Broken: Closest junction is too far away.

Jeroen.

#34 User is online   James Ross 

  • Open Rails Developer
  • Group: Status: Elite Member
  • Posts: 5,491
  • Joined: 30-June 10
  • Gender:Not Telling
  • Simulator:Open Rails
  • Country:

Posted 27 May 2015 - 11:58 AM

View PostJeroenP, on 27 May 2015 - 11:21 AM, said:

I could not find a reference/post related to this broadcast feature.

It was briefly mentioned here and more extensively discussed here (it's just a standard web server rather than something which broadcasts at the network level).

#35 User is offline   JeroenP 

  • Fireman
  • Group: Status: Active Member
  • Posts: 179
  • Joined: 28-December 13
  • Gender:Male
  • Simulator:ORTS
  • Country:

Posted 31 May 2015 - 11:57 AM

I added initial zooming capability to the charts. Not everything looks nice yet, and I am aware of the fact that sliding the chart with the mouse will also slide the main view window (which should be fixed).

Jeroen.

#36 User is offline   JeroenP 

  • Fireman
  • Group: Status: Active Member
  • Posts: 179
  • Joined: 28-December 13
  • Gender:Male
  • Simulator:ORTS
  • Country:

Posted 20 June 2015 - 12:33 AM

Dear all,
As I mentioned elsewhere I indeed starting on providing web-based outputs for the charts. This is based on an earlier post in this thread: http://www.elvastowe...ost__p__180779. The idea is as follows: From Trackviewer the chart data is saved in a .json file. I am creating a javascript file that reads the .json file and draws the chart on an html5 canvas. This javascript file is independent of the route path being shown. I provide an example.html which contains the bare minimum to create the canvas, load the javascript which in its turn loads the json file. The example result (under construction) is then something like:
Attached Image: charts in browser.jpg

I imagine that it is then possible for other people to create nicer web-pages around the canvas. Possibly adding text about the route, activity information, or whatever. This can then be done in standard HTML and is therefore independent of other openrails c# code. For flexibility, I am also adding some configuration items (to be able to increase/decrease the various parts within the canvas.) I do not yet have any idea on how to supply the content from within the simulator. And I am not sure that is the best way to go either.

I also do not yet really know where to put this into SVN. I am currently developing in a separate visual studio project, which is reasonably nice, but I think that is a bit of overkill to put it in SVN.

Best regards
Jeroen

#37 User is online   James Ross 

  • Open Rails Developer
  • Group: Status: Elite Member
  • Posts: 5,491
  • Joined: 30-June 10
  • Gender:Not Telling
  • Simulator:Open Rails
  • Country:

Posted 20 June 2015 - 01:09 AM

View PostJeroenP, on 20 June 2015 - 12:33 AM, said:

I also do not yet really know where to put this into SVN. I am currently developing in a separate visual studio project, which is reasonably nice, but I think that is a bit of overkill to put it in SVN.

If you do want to include it, I think it probably fits best as another folder inside Source\Contrib. If it's not useful to build it with all the other code, you can still put it there but just don't add the project to the ORTS.sln.

#38 User is offline   Genma Saotome 

  • Owner Emeritus and Admin
  • PipPipPipPipPipPipPipPipPipPipPipPipPip
  • Group: ET Admin
  • Posts: 15,356
  • Joined: 11-January 04
  • Gender:Male
  • Location:United States
  • Simulator:Open Rails
  • Country:

Posted 20 June 2015 - 11:54 AM

Perhaps there is someone on the board who knows .css well enough to create a pair of templates, one suitable for ordinary computer screens and another for phones / tablets. Once provided I suspect more information to present therein will follow rather quickly.

#39 User is offline   JeroenP 

  • Fireman
  • Group: Status: Active Member
  • Posts: 179
  • Joined: 28-December 13
  • Gender:Male
  • Simulator:ORTS
  • Country:

Posted 23 June 2015 - 11:40 AM

I have submitted the code to be able to save the chart data into a .json file. There is a button on the bottom-left of the chart window (now that the + and - buttons are no longer needed.

To this post I add the visual studio solution that I used to develop the web-page part. I added some documentation, that I repeat for clarity.

Quote

These files are intended to make it possible to add a chart of a certain train path (from a .pat file) to a web-page. The only file you really need is the Scripts/drawPathChart.js. The rest of the files are only there to have a working example.

Obviously this readme is not going to tell you how to make a web-site or how to use javascript on such a web-site. This readme is only going to tell you about adding a path chart.
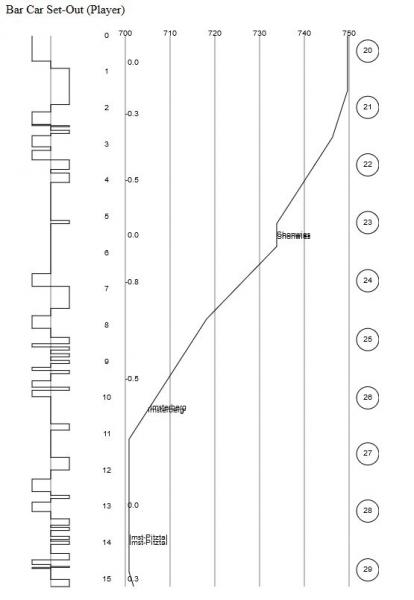
  • Use Contrib.TrackViewer to load your route, load a path for your route (Path-Editor menu), show the chart for it (also Path-Editor menu), and save this as a .json file (button in the window). Place this .json file somewhere in your web-site directory structure
  • Copy the Scripts/drawPathChart.js to your website directory. Make sure it is loaded from the HTML.
  • Call the LoadAndDraw method from another javascript routine, after the loading of the web-site is done
The other example files do the following:
  • chartexample.html: This is a very simple example HTML. It loads to scripts and it has two elements: one for the textual header and one for the canvas. The canvas will be used to draw the chart upon.
  • Scripts/chartexample.js: An example javascript file that shows how to use the javascript code in drawPathChart.js. It contains configuration options
    (many of these are not needed because the defaults are decent as well). It also contains the call to the LoadAndDraw method, with the name of the
    .json file that needs to be loaded as well as an optional callback function that is called after the drawing is finished.
  • Content/examplepathchartdata.json. An example of path data saved from TrackViewer.
All the other files are there for using Microsoft Visual Studio for web-site development. But there is no need at all to use Visual Studio. Use whatever you are comfortable with.

Attached File  Trackviewer web.zip (43.7K)
Number of downloads: 180

View PostJames Ross, on 20 June 2015 - 01:09 AM, said:

If you do want to include it, I think it probably fits best as another folder inside Source\Contrib. If it's not useful to build it with all the other code, you can still put it there but just don't add the project to the ORTS.sln.

Indeed, it is not useful to build the web-part with the rest. For two reasons. First, there is nothing to build. It is HTML and javascript, no compilation at all. Second, the idea is that only one file is really needed (drawPathChart.js) for the user, but it is needed in the sense that it needs to be copied to a web-site. That web-site is not in this code, and it cannot be. For each new route/path a different .json is needed. And hence a different web-site (or for someone with an extensive web-site, of course, it could contain multiple .json files that can be selected via a web-interface). The rest of the files are examples.

Adding it as an extra project in Contrib is possible. But when we do not add it to the main solution, you cannot actually open it (a project needs a solution). Or, rather, if you open it it will create the .sln file itself. And having to add it to the main solution each time you want to work on it and making sure you never commit the main solution is also not nice.

I saw some other posts on ideas for web-interaction with the simulator.. Possibly it makes sense to have a separate directory as a placeholder for that kind of web-content/web examples that can be used together with the game (so different from the openrails.org web-site).

View PostGenma Saotome, on 20 June 2015 - 11:54 AM, said:

Perhaps there is someone on the board who knows .css well enough to create a pair of templates, one suitable for ordinary computer screens and another for phones / tablets. Once provided I suspect more information to present therein will follow rather quickly.
For the moment what I created does not contain any css.I do not recall every writing css myself. Also javascript was completely new for me. I am reading a lot these weeks :) on these subjects. Most likely there are quite some improvements possible related to making the code more flexible to deal with different layouts and screen sizes.But in principle the chart part is only a small part of a web-site anyway.

Best regards. Jeroen

#40 User is offline   Reece202 

  • Apprentice
  • Group: Status: New Hire
  • Posts: 2
  • Joined: 19-February 15
  • Gender:Not Telling
  • Simulator:Open Rails
  • Country:

Posted 24 June 2015 - 06:50 AM

I've attempted to load the example html in Chrome, Firefox, and IE. Chrome and Firefox both display a JavaScript error; "Tried loading Content/examplepathchartdata.json but did not succeed: 0" and the page only shows "Chart" and no other elements. IE shows the same but doesn't display the JavaScript error. I tried replacing the example data with a different .json from the path viewer, but I get the same result.

I'm not sure where the sticking point is, but I'd hazard a guess that there's something acting up in the LoadAndDraw code.

  • 5 Pages +
  • « First
  • 2
  • 3
  • 4
  • 5
  • You cannot start a new topic
  • You cannot reply to this topic

1 User(s) are reading this topic
0 members, 1 guests, 0 anonymous users