 Log In
 Register Now!
 Help
Help

Hi Folks,
Spoken like a true steam guy: " It would be good also if in the game the player could pull up a view of the track ahead in a gradient view to see what they are potentially facing."
At some point I would hope to see this information available in the "Track Viewer" HUD - in game...
Regards,
Scott
Two suggestions for Trackviewer
Rate Topic:

#21

- Vice President
-

- Group: Status: First Class
- Posts: 2,973
- Joined: 06-July 09
- Gender:Male
- Location:Downeast Maine (soon)
- Simulator:ORTS
-
Country:

Posted 14 May 2015 - 02:56 AM
#22
- Fireman
-

- Group: Status: Active Member
- Posts: 179
- Joined: 28-December 13
- Gender:Male
- Simulator:ORTS
-
Country:

Posted 20 May 2015 - 11:34 AM
 Genma Saotome, on 13 May 2015 - 04:38 PM, said:
Also, that chart I referenced above, please note that where grade is printed it means a grade change and not the center of the section of that grade. That new grade value is applicable to the track from the printed number going right to the next printed grade number. I assume this is due to our reading left to right. It's a bother if your train is traveling from right to left but I'm not sure there is any better way to do this than what the example shows us.
I am confused on your statements here. I suppose you were talking about chart example. At the bottom there is a chart showing curves. There are numbers like 1 15' (which I assume means a curve of 1 degree and 15 seconds).
Just a but above that it seems like there is a height chart. The line is almost flat, but not quite. The numbers below the height line are 1059.6, 1080.0, 1081.5 etc., and I think these mean height (in feet probably). Just above the height line there are numbers like -0.17, -0.27, -0.20, -0.25, 0.00. To me these look like grades (in percent?). They also look like grades between the height indications. E.g. I get -0.27 grade between 1059.6 and 1080.0, and I get 0.00 grade between 1085.3 and 1085.3. The numbers are negative, probably because the distance along the track is calculated from right to left. The mile markers seem to be almost at the top, in circles. From left to right 290, 289, and counting down.
So I think the grade numbers are actually located at the center of the section with that grade.
Apart from the details, let me tell you where I am. I am currently able to create graphs like (from default Marias pass)
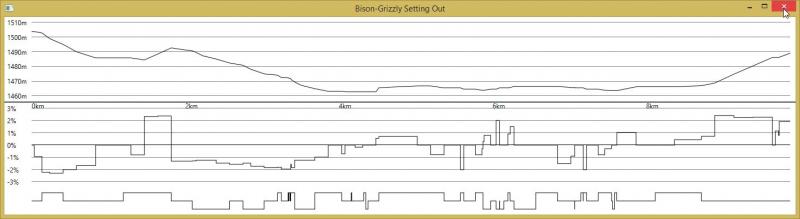
At the top is the height (shown in meters, but feet is also supported). Then there is the grade (currently also shown as a chart, in %). In between is the distance along the path (km or miles).
At the bottom is the curve chart. So this does not (yet?) have the nice half-circles, but it is possibly better than using color. There is no indication of the radius of the curve, nor of how many degrees the curve is.
So many things work: the window can be opened, it can be sized at will. It is redrawn when a new path is selected. It closes on broken paths (no plans to support charting broken paths). It even updates while doing path edits. And obviously the data from the path and tracks is all there (including dealing with sections that move in the other direction). The grade is coming from the AX parameter ('pitch'), and not from a numerical derivative of the height, because that has numerical issues.
There is quite some visual improvements that are still possible. And also additions like station names, and perhaps a link between the how far the path is drawn and the chart to make it easier to see where you are on the chart.
But one of the things that worries me is that the curves and the grade are not very smooth. Let me add another example
Long curves can be intersected by small straight tracks. If I was making these kinds of charts manually, it would be easy to neglect that. And just say that the curves continues. But doing this automatically is not easy.
Something similar happens with the grade. I expected the grade to be much more continuous. Instead I have seen in some cases that the grade is really jumping around from one section to the next. This might be related to the accuracy of the person defining the terrain. But I am not sure. Again, I assume that if someone would have to make a chart for a real track, there would be some effective averaging or smoothing.
So the groundwork is ready. But it is not yet looking nice.
Best regards. Jeroen.
#23
- Member, Board of Directors
-

- Group: Status: Elite Member
- Posts: 7,010
- Joined: 31-December 11
- Gender:Male
-
Country:

Posted 20 May 2015 - 12:11 PM
That's a great achievement, Jeroen! I can confirm that in the USA2 route (and not only) there are grade jumps from one track section to the other one. Bad track layout.
Curve radius would be quite interesting. Maybe it can be achieved by modulating the height of the chart segments (greater height = smaller radius) and adding a scale.
Curve radius would be quite interesting. Maybe it can be achieved by modulating the height of the chart segments (greater height = smaller radius) and adding a scale.
#24
- Owner Emeritus and Admin
-

- Group: ET Admin
- Posts: 15,356
- Joined: 11-January 04
- Gender:Male
- Location:United States
- Simulator:Open Rails
-
Country:
Posted 20 May 2015 - 01:26 PM
JeroenP, on 20 May 2015 - 11:34 AM, said:
I am confused on your statements here.
So I think the grade numbers are actually located at the center of the section with that grade.
So I think the grade numbers are actually located at the center of the section with that grade.
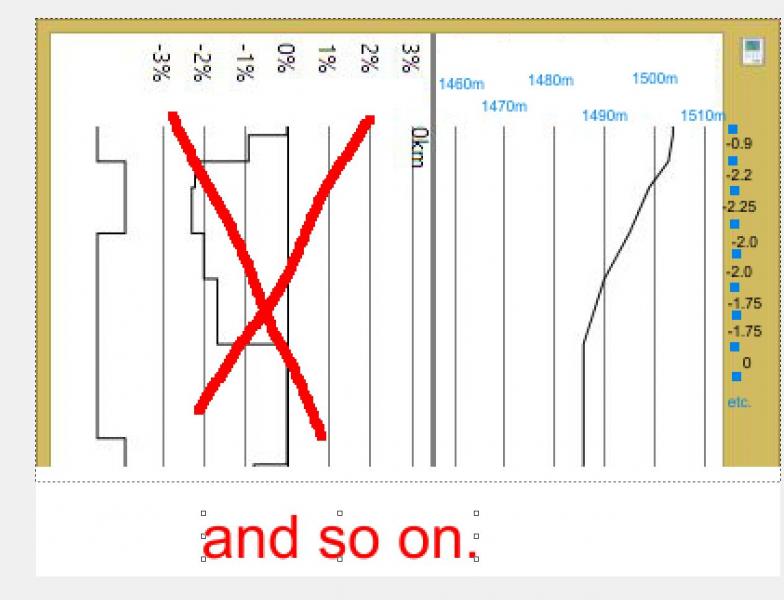
I screwed up. I had been looking at an old chart in my hands and assumed the way it was showing things was the smae as what was in that url. So you are correct... the grade you looked at is lettered in the center of the section is represents. OTOH, as a caution, you will find charts where the grade is not printed in the center but at one or the other end of that section of track, representing where the new grade starts (or ends) depending on in which direction you are reading.
WRT to poor appearance of the second and third sets of data you graphed, for me only the second one feels less-than-useful. Perhaps increasing the width of the X axis would give you the space to display the maximum grade between mileposts / kmposts and to do so as part of the first graphic image. See, what was throwing me off in the second chart was using the gradient as the vertical axis... I don't think that works very well.
The only other comment is to suggest that it would be worthwhile to rotate the graphing 90d so the long axis is scrolled up/down. It gives you several advantages: unlike paper, the long axis on computer screens is usually vertical. A 90d rotate would make it easier to print anything specific to a location, whether it is a milepost marker, station, or siding name and third it would leave the door open to the use of an html broadcast into a handheld device, such as a phone or tablet where once again, the vertical axis being long works better. It would like like this:
#25
- Vice President
-
- Group: Status: First Class
- Posts: 2,345
- Joined: 24-March 10
- Gender:Male
- Simulator:Open Rails - MSTS
-
Country:
Posted 20 May 2015 - 02:55 PM
This is a terrific advancement and I'm sure it will look nice in due time. Looks pretty nice already, I think.
I'd vote for horizontal display of grades as you had it before simply because it matches prototype practice, at least in this part of the world and thus (selfishly) matches what I am used to looking at (I do look at grade charts, both personally and professionally)
Christopher
I'd vote for horizontal display of grades as you had it before simply because it matches prototype practice, at least in this part of the world and thus (selfishly) matches what I am used to looking at (I do look at grade charts, both personally and professionally)
Christopher
#26
- Fireman
-
- Group: Status: Active Member
- Posts: 179
- Joined: 28-December 13
- Gender:Male
- Simulator:ORTS
-
Country:
Posted 21 May 2015 - 12:46 PM
Dear all,
Some small improvements and food for thought.
So three changes.
I do understand the idea of being able to have a very long (vertical) 'picture' that you can share with your route so people can have a look at it. I have no idea (yet) on how to generate such a thing, though. Especially since I think you want it actually longer than screen size, not?
Jeroen.
Some small improvements and food for thought.
So three changes.
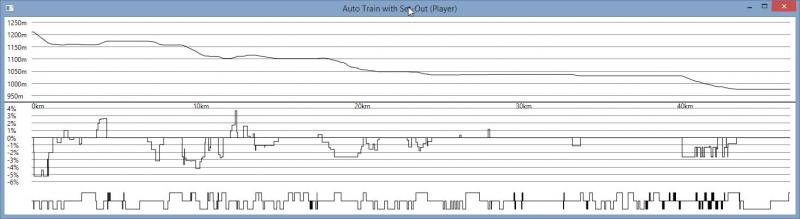
- Showing that feet and miles are already supported. Should that be 'Mi' instead of 'M'? Do note that they are not mile markers, they are miles along the path! And this path happens to have some reversals.
- The top chart now has grade in text. Not bad. But it is on this short route already clear that in some places the grade changes are happening so often that the numbers will be on top of each other. On a longer route this will be even more visible. I now have the grade rotated 90 degrees, again to prevent them to be too much on top of each other. But Christopher would like them to be horizontal, not? (Obviously, zooming will help, and so will a screen with 8000 horizontal pixels ;)). So although I can imagine that having text like this is more along the lines of what you are used to, having the grade-charts at least helps me visualize the data for debugging.
- The bottom chart now shows curvature = 1/radius. This is 0 for straight track. The sign is still whether it curves left or right. So along the idea of Carlo (I played with it before). I do not think this is at the moment very useful. Perhaps 1/radius is not the right measure? I did notice (on another curve) that sometimes very small sections have very large curvature. Because of the automatic scaling I have, the rest of the curvature is then no longer visible.
I do understand the idea of being able to have a very long (vertical) 'picture' that you can share with your route so people can have a look at it. I have no idea (yet) on how to generate such a thing, though. Especially since I think you want it actually longer than screen size, not?
Jeroen.
#27
- Owner Emeritus and Admin
-
- Group: ET Admin
- Posts: 15,356
- Joined: 11-January 04
- Gender:Male
- Location:United States
- Simulator:Open Rails
-
Country:
Posted 21 May 2015 - 01:37 PM
JeroenP, on 21 May 2015 - 12:46 PM, said:
I do understand the idea of being able to have a very long (vertical) 'picture' that you can share with your route so people can have a look at it. I have no idea (yet) on how to generate such a thing, though. Especially since I think you want it actually longer than screen size, not?
Jeroen.
Jeroen.
The reasoning behind using a vertical display comes from a discussion last year (I think) about the feasibility of using a smart phone or tablet (which are often in a the portrait orientation) for reading help text and/or any other text produced by the OR software. James said it would be pretty easy to add an html "broadcast" feature to enable the idea. It hasn't happened yet, but it could be done. So there's that reason. In addition there is problem a horizontal orientation has in integrating text that applies to a very specific location. You either have to write the letters in a vertical stack to keep it narrow or have enough room that the use of normal horizontal letters don't over-run other text. If you rotate everything 90d then any text you want to show is printed horizontally and so remains both narrow (one letter wide) and unlikely to overwrite other text.
The downside is, of course, most track charts take a horizontal orientation... indeed if you can get your hands on old blueprints they can be 10, 12, 16 feet long. But paper is paper and digital hardware is fundamentally different so maybe thinking a bit different on this issue might bring better results.
#28
- Fireman
-
- Group: Status: Active Member
- Posts: 179
- Joined: 28-December 13
- Gender:Male
- Simulator:ORTS
-
Country:
Posted 22 May 2015 - 11:39 PM
Now that 1.0 is out, I committed the current version (still to go further) so you can play as well.
Jeroen.
Jeroen.
#29
- Member, Board of Directors
-
- Group: Status: Elite Member
- Posts: 7,010
- Joined: 31-December 11
- Gender:Male
-
Country:
Posted 23 May 2015 - 05:21 AM
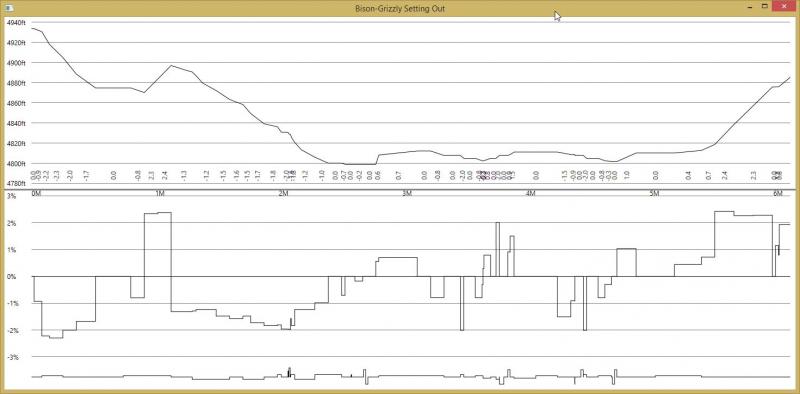
Thanks Jeroen! I immediately tested it with the short but demanding Bernina Freeware.
Here is the display of the profile:
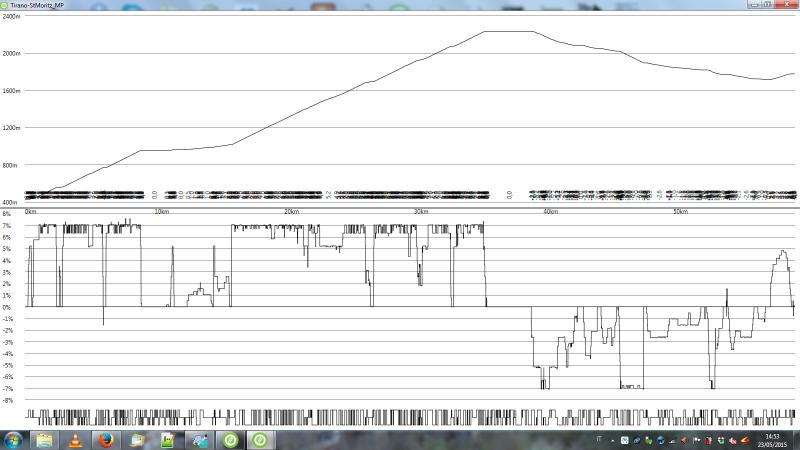
I find it impressive (by the way I appreciated how the original author of the route respected the real track profile, that has a maximum grade of 7%. As can be seen, there is something strange in the horizontal legend of the profile.
I think that it would be nice if the station names could be added.
Here is the display of the terrain textures:
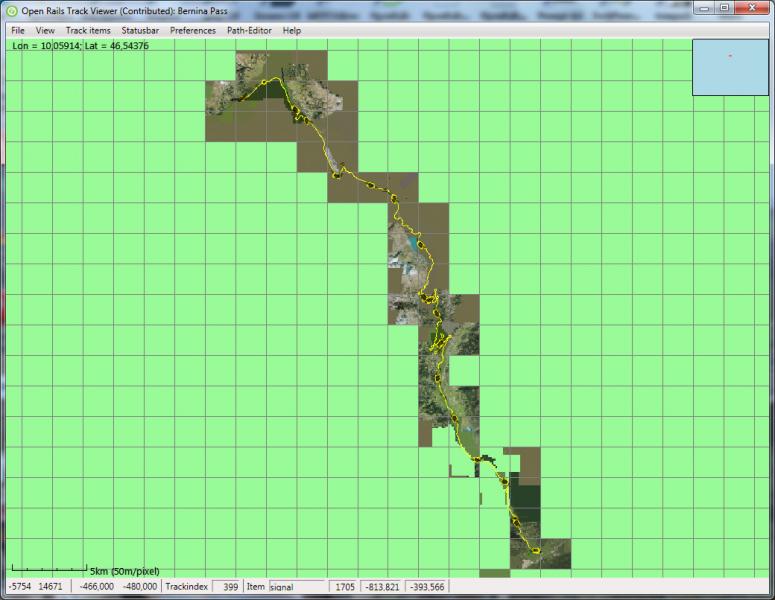
I got some problem here. The route uses some thousands of photographic textures. When displaying the above picture, the NVidia driver got into trouble, and didn't show all the textures. Also computing time was very high. Mosaic hasn't this problem, although it starts showing only part of the route, and not the complete route like Trackviewer.
Here is the display of the profile:
I find it impressive (by the way I appreciated how the original author of the route respected the real track profile, that has a maximum grade of 7%. As can be seen, there is something strange in the horizontal legend of the profile.
I think that it would be nice if the station names could be added.
Here is the display of the terrain textures:
I got some problem here. The route uses some thousands of photographic textures. When displaying the above picture, the NVidia driver got into trouble, and didn't show all the textures. Also computing time was very high. Mosaic hasn't this problem, although it starts showing only part of the route, and not the complete route like Trackviewer.
#30
- Owner Emeritus and Admin
-
- Group: ET Admin
- Posts: 15,356
- Joined: 11-January 04
- Gender:Male
- Location:United States
- Simulator:Open Rails
-
Country:
Posted 23 May 2015 - 10:45 AM
I also looked at the first edition of terrain display. Off to a good start! And... a bit of work left to do, so a couple of observations:
If you are zoomed in somewhere and toggle display terrain the only terrain that is loaded is what covers the displayed area. Back out a bit and the newly exposed area does not show terrain. Toggle the key and it all goes away. Toggle it again and once again the terrain for the current view is loaded. Might it be better to load all terrain at one go?
Second observation is by a large margin, not all tiles w/ terrain will show the terrain w/o regard to the current view. I'm not sure if I want to call this a problem or not as the route I was looking at is very generous about tiles so as to provide viewing out to 10k. What is the criteria you use to choose not to display terrain in some tiles?