 Log In
 Register Now!
 Help
Help

OR Memory Issues
Rate Topic:

#21

- Foreman Of Engines
-

- Group: Private - Open Rails Developer
- Posts: 818
- Joined: 07-October 12
- Gender:Male
- Simulator:OpenRails
-
Country:

Posted 11 September 2014 - 01:43 AM
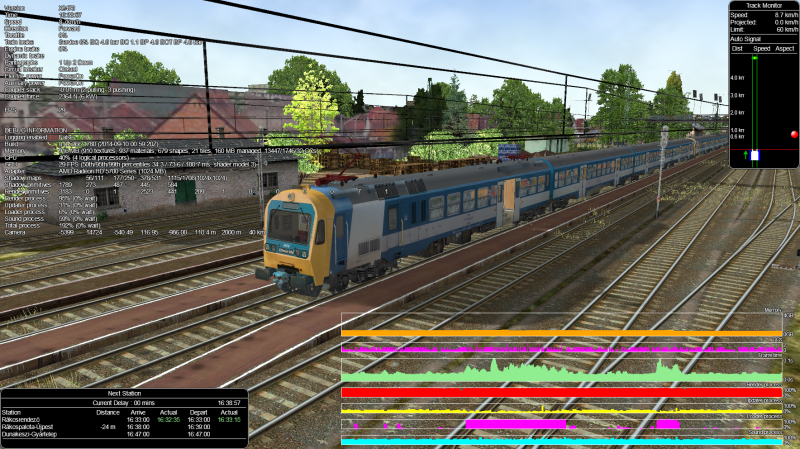
In stuttering time the GC graph has spikes (mostly at loading time), and valleys which are rapidly following each other.
#22

- Open Rails Developer
-

- Group: Status: Elite Member
- Posts: 5,491
- Joined: 30-June 10
- Gender:Not Telling
- Simulator:Open Rails
-
Country:

Posted 11 September 2014 - 01:50 AM
disc, on 11 September 2014 - 01:43 AM, said:
In stuttering time the GC graph has spikes (mostly at loading time), and valleys which are rapidly following each other.
Open Rails 2014-09-10 11-41-00.png
Open Rails 2014-09-10 11-41-00.png
Hmm, that's a very noisy GC graph. I don't think I've seen anything like that before. Mine rarely gets anywhere close to that - it usually goes a dozen frames or more with no GCs at all, where as yours has generation 0 collections pretty much every frame. The FPS data suggests a very unstable frame rate, as you'd expect with stuttering.
What's it like with everything turned off on an MSTS in-box route? I get nearly nothing on the GC graph (literally less than a dozen GCs across the entire chart, typically) and that's with everything on. I wonder what's causing this high GC activity.
#23
- Superintendant
-
- Group: Status: Elite Member
- Posts: 1,772
- Joined: 27-October 12
- Gender:Male
- Location:Budapest
- Simulator:OpenRails
-
Country:
Posted 11 September 2014 - 02:00 AM
Isn't the unloading makes work to GC? Maybe unloading content should be smoothed a bit for not doing a whole tile in a single moment.
#24
- Foreman Of Engines
-
- Group: Private - Open Rails Developer
- Posts: 818
- Joined: 07-October 12
- Gender:Male
- Simulator:OpenRails
-
Country:
Posted 11 September 2014 - 02:07 AM
Here is screenshot with a default route, the FPS is locked at 60, but there are constant GC spikes here too.
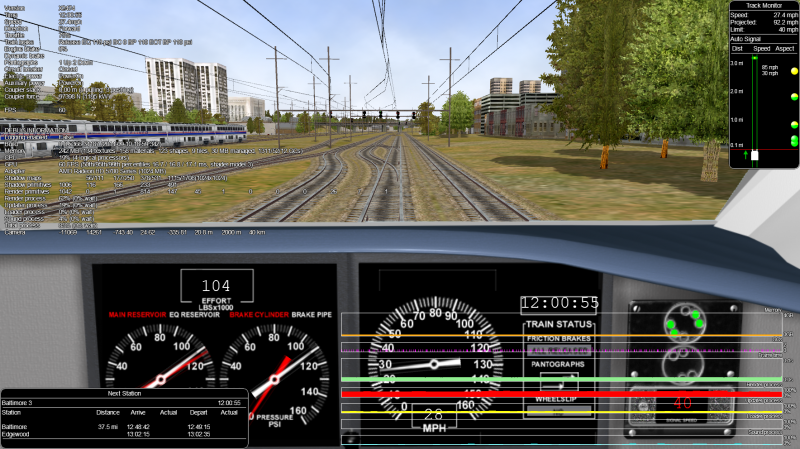
And the GPU usage never goes above 60%, nor on default or on heavily populated routes like above.
And the GPU usage never goes above 60%, nor on default or on heavily populated routes like above.
#25
- Open Rails Developer
-
- Group: Status: Elite Member
- Posts: 5,491
- Joined: 30-June 10
- Gender:Not Telling
- Simulator:Open Rails
-
Country:
Posted 11 September 2014 - 02:11 AM
gpz, on 11 September 2014 - 02:00 AM, said:
Isn't the unloading makes work to GC? Maybe unloading content should be smoothed a bit for not doing a whole tile in a single moment.
Unloading causes less GC activity than loading. Loading creates many, many temporary objects while processing the data before it settles down, unloading discards a much smaller amount. GCs are triggered by allocation (so trigger much more during loading) and their performance scales with the amount of garbage they're removing (which is high during loading). Unloading isn't innocent but I've measured it and loading is way worse.
#26
- Open Rails Developer
-
- Group: Status: Elite Member
- Posts: 5,491
- Joined: 30-June 10
- Gender:Not Telling
- Simulator:Open Rails
-
Country:
Posted 11 September 2014 - 02:14 AM
disc, on 11 September 2014 - 02:07 AM, said:
Here is screenshot with a default route, the FPS is locked at 60, but there are constant GC spikes here too.
Open Rails 2014-09-11 12-05-22.png
And the GPU usage never goes above 60%, nor on default or on heavily populated routes like above.
Open Rails 2014-09-11 12-05-22.png
And the GPU usage never goes above 60%, nor on default or on heavily populated routes like above.
Hmm, curious. Locked to 60 FPS on a default route, I have so little GC activity it is basically meaningless. Your FPS seems stable here but I guess that's because it's locked to v-sync. I'll have to check this out on my system again in case something's changed since I last observed it.
#27
- Foreman Of Engines
-
- Group: Private - Open Rails Developer
- Posts: 818
- Joined: 07-October 12
- Gender:Male
- Simulator:OpenRails
-
Country:
Posted 11 September 2014 - 02:20 AM
When i disable vsync, i get 93 fps, but the frame time is stable there.
Isn't there a tool that can be used for profiling .net applications (cpu usage of, methods, memory accesses).
Isn't there a tool that can be used for profiling .net applications (cpu usage of, methods, memory accesses).
#28
- Open Rails Developer
-
- Group: Status: Elite Member
- Posts: 5,491
- Joined: 30-June 10
- Gender:Not Telling
- Simulator:Open Rails
-
Country:
Posted 11 September 2014 - 02:30 AM
disc, on 11 September 2014 - 02:20 AM, said:
When i disable vsync, i get 93 fps, but the frame time is stable there.
Isn't there a tool that can be used for profiling .net applications (cpu usage of, methods, memory accesses).
Isn't there a tool that can be used for profiling .net applications (cpu usage of, methods, memory accesses).
There's a few, what do you actually want to measure though? You can't possibly measure memory access but you can trace method calls, memory usage, CPU usage, GPU calls/usage, file and other OS access, trace GC and JIT and probably some other things. (Example tools are dotTrace Performance/Memory, XPerf, Windows Performance Recorder/Viewer, PerfView.)
#29
- Foreman Of Engines
-
- Group: Private - Open Rails Developer
- Posts: 818
- Joined: 07-October 12
- Gender:Male
- Simulator:OpenRails
-
Country:
Posted 11 September 2014 - 03:14 AM
James Ross, on 11 September 2014 - 02:30 AM, said:
There's a few, what do you actually want to measure though? You can't possibly measure memory access but you can trace method calls, memory usage, CPU usage, GPU calls/usage, file and other OS access, trace GC and JIT and probably some other things. (Example tools are dotTrace Performance/Memory, XPerf, Windows Performance Recorder/Viewer, PerfView.)
I was just curious what the game does in runtime, especially what causing that the sound thread is using sometimes 70% cpu, and sometimes just 10% while, no audible differences in sounds. So i installed the free, opensource "SlimTune" profiler, and i saw that the sound process spends 60% of its cpu time with the track sounds, 40% left for any other sounds, which look weird. So i removed all tracksounds (16), and the sound process cpu usage dropped from 70% to 30%. Of course this isn't connected to stuttering, it was just curiosity.
And now i see, that the sms setting for this route have serious overkill settings with lots of active sounds to active to 500 metres and more, and a lot of them have really unrealistic distance to volume settings. (funny thing that i helped configuring sounds for railworks/ts and the most of sounds got deactivated at 300 metres, and that was fairly enough)
#30
- Superintendant
-
- Group: Status: Elite Member
- Posts: 1,772
- Joined: 27-October 12
- Gender:Male
- Location:Budapest
- Simulator:OpenRails
-
Country:
Posted 11 September 2014 - 03:22 AM
Unfortunately handling of track sounds is a mess currently, and it is highly suboptimal for giant routes (like Alföld). I haven't even tried to modify it, since it would need a big rewrite.