 Log In
 Register Now!
 Help
Help
Page 1 of 1
Fun with graphs
the Profiling regedit
Rate Topic:

#1

- Conductor
-

- Group: Status: Active Member
- Posts: 425
- Joined: 17-August 08
- Gender:Male
- Location:Surrey B.C.
-
Country:

Posted 14 March 2011 - 07:12 PM
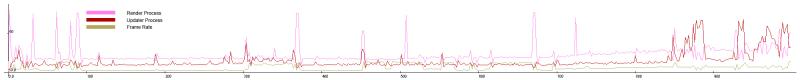
I may be the only none dev who knows how to access this but the Profiling is fun to play with. This is a graph of my crappy PC.
#2
- Open Rails Developer
-

- Group: Status: Elite Member
- Posts: 3,179
- Joined: 25-July 08
- Gender:Male
- Location:Manasquan, NJ
- Simulator:Open Rails, MSTS editors
-
Country:

Posted 15 March 2011 - 04:13 AM
Open Rails has a built-in ability to do exactly what you've done.
Within the F5 HUD, the first line of the extended display of system information has a line "Logging". Pressing F12 at any time will enable logging - essentially dumping FPS, process utilization and other information to a .csv file which can be opened in Excel. Pressing F12 a second time will stop the frame by frame logging. You can chart and graph to your hearts content. This was designed to assist the OR team in performance testing, but it's available to all users. The csv file is located in your main Open Rails folder.
Within the F5 HUD, the first line of the extended display of system information has a line "Logging". Pressing F12 at any time will enable logging - essentially dumping FPS, process utilization and other information to a .csv file which can be opened in Excel. Pressing F12 a second time will stop the frame by frame logging. You can chart and graph to your hearts content. This was designed to assist the OR team in performance testing, but it's available to all users. The csv file is located in your main Open Rails folder.
#3
- Conductor
-
- Group: Status: Active Member
- Posts: 425
- Joined: 17-August 08
- Gender:Male
- Location:Surrey B.C.
-
Country:
Posted 15 March 2011 - 08:50 AM
I was looking a the log and thought that all the firs group of values might be editable in the registry, so I tried the profiling and found the csv file, looked for graphing software, and made a graph. the F12 key is good to know about so that i don't need to remember to edit my registry every time. thanks Chris
Page 1 of 1